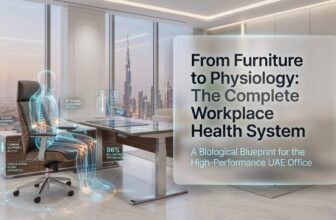
The Shift from Intuition to Intelligence in Office Design
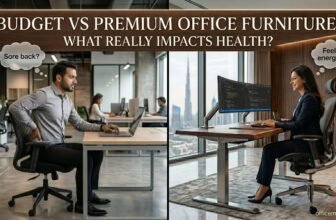
For decades, office furniture procurement was a discipline guided by aesthetics, budget constraints, and the subjective preferences of interior designers. The standard approach: choose a reputable brand, select ergonomic-looking chairs, install modular desks in rows, and hope employee productivity followed. That era is definitively over.
Today, the most competitive organizations from Dubai-based multinational headquarters to Silicon Valley campuses are making furniture and workplace decisions through the lens of hard data. Sensor arrays embedded in task chairs track posture and pressure distribution. Occupancy analytics reveal that the average corporate office desk sits vacant 40% of the working day. AI-powered space planning platforms calculate optimal furniture configurations before a single piece is purchased. And real-time dashboards give facilities managers unprecedented visibility into how physical space drives or detracts from human performance.
This is the world of data-driven office furniture design: a convergence of workplace science, IoT engineering, ergonomic research, and predictive analytics that is permanently transforming how office furniture is selected, arranged, monitored, and optimized. For decision-makers in the UAE and globally, understanding this shift is no longer optional. It is a strategic imperative.
Whether you are procuring office furniture for a new headquarters in the Dubai International Financial Center, retrofitting a hybrid-ready workspace in Abu Dhabi, or designing a globally distributed workplace strategy, this guide delivers the research, frameworks, and actionable intelligence you need to lead with data — not guesswork.
1. What Is Data-Driven Office Furniture Design? A Comprehensive Definition
Data-driven office furniture design refers to the systematic use of empirical data — gathered through occupancy sensors, ergonomic analytics platforms, employee experience surveys, productivity tracking systems, and AI-powered modelling tools — to inform every stage of the furniture lifecycle: from initial specification and procurement through deployment, ongoing optimization, and eventual replacement.
Unlike traditional design approaches that rely on vendor catalogues, generic ergonomic standards, or the aesthetic judgement of architects alone, data-driven design treats the workspace as a living system that generates measurable signals. These signals answer fundamental business questions:
- Which workstations are actually used, and at what frequency?
- What percentage of employees experience musculoskeletal discomfort linked to their furniture?
- How does desk configuration correlate with focus work vs. collaborative output?
- What is the quantifiable return on investment from upgrading to ergonomic seating?
- How much real estate cost can be eliminated through activity-based working supported by smart furniture?
The answers to these questions, when backed by reliable data, allow organizations to make procurement decisions that are simultaneously more human-centered and more commercially justified — a combination that has historically been elusive in workplace design.
The Three Pillars of Data-Driven Furniture Strategy
Practitioners in this field typically organize their approach around three interdependent pillars:
- Measurement Infrastructure: The sensors, platforms, and data collection methodologies that generate workplace intelligence.
- Analytical Frameworks: The models, benchmarks, and interpretive tools that transform raw data into actionable insight.
- Iterative Optimization: The continuous feedback loops that enable furniture environments to evolve in response to changing work patterns, headcount, and business requirements.
Traditional vs. Data-Driven Office Furniture Design — A Comparative Overview
| Dimension | Traditional Approach | Data-Driven Approach |
|---|---|---|
| Decision Basis | Vendor recommendations, aesthetics, budget | Occupancy analytics, usage data, ergonomic metrics |
| Ergonomic Standard | One-size-fits-all, catalogue compliance | Personalized bio-metric and postural data |
| Space Utilization | Estimated via headcount ratios | Real-time sensor measurement (avg. utilization rates) |
| Procurement Cycle | Periodic, reactive (every 7-10 years) | Continuous optimization, modular refresh cycles |
| Employee Input | Annual surveys, informal feedback | Real-time comfort dashboards, app-based reporting |
| ROI Measurement | Anecdotal, difficult to quantify | Trackable productivity, health, and cost metrics |
| Technology Integration | Minimal (cable management only) | IoT, AI planning, smart adjustment systems |
| Environmental Impact | Post-purchase consideration | Lifecycle data informs sustainable procurement |

2. The Workplace Data Revolution: Key Statistics Driving the Industry
The business case for data-driven office furniture design is not theoretical — it is grounded in a mounting body of evidence from global workplace research. Understanding these statistics is essential context for any strategic decision-maker evaluating their furniture estate.
Occupancy and Space Utilization
- Average desk utilization in traditional corporate offices sits between 50-60%, with many organizations reporting rates as low as 40% on peak days, according to Leesman workplace research.
- JLL’s 2024 Global Real Estate Outlook found that optimized space planning — enabled by occupancy analytics — can reduce real estate costs by 20-30% without reducing employee satisfaction.
- Organizations that have implemented sensor-based occupancy monitoring report identifying 25-35% more reclaimable space than manual observation methods detected.
- Activity-based working (ABW) environments supported by smart furniture allocation systems achieve desk-sharing ratios of 0.6:1 to 0.8:1, compared to the traditional 1:1 ratio, generating substantial real estate savings.
Ergonomics and Workforce Health Economics
- The World Health Organization estimates that musculoskeletal disorders (MSDs) — the leading cause of work disability globally — cost employers an estimated 1-2.5% of GDP annually in lost productivity and healthcare costs.
- A landmark study published in the Journal of Occupational and Environmental Medicine found that investing USD $1 in ergonomic workplace improvements returns an average of USD $3-17 in productivity gains and reduced absenteeism.
- According to OSHA data, ergonomic-related workplace injuries account for approximately 33% of all worker compensation costs in sedentary office environments.
- Organizations that deploy adjustable-height desks report a 46% reduction in upper back pain and a 54% reduction in neck discomfort among users within six months, based on a Stanford Medicine workplace study.
Productivity and Engagement Correlations
- The Leesman Index — the world’s largest workplace experience database — consistently demonstrates that employees working in evidence-based environments report 20-32% higher productivity self-assessment scores.
- Research from the University of Exeter found that employees given control over the design and layout of their workspace are 32% more productive than those working in lean, manager-designed spaces.
- Harvard Business Review analysis of Fortune 500 companies revealed that high-performing workplace environments — defined by data-optimized furniture, lighting, and acoustic configuration — are associated with 21% higher profitability.
- In the UAE specifically, a 2024 CBRE Workplace Survey found that 68% of employees in Dubai-based multinational offices cited physical workspace quality as a top-three factor in their decision to remain with or leave an employer.
ROI Metrics from Data-Driven Workplace Furniture Investments
| Investment Category | Typical Cost (USD/employee) | Measured ROI | Payback Period |
|---|---|---|---|
| Height-adjustable desks | $800 – $2,500 | 15–25% productivity gain; 40–50% MSD reduction | 6–18 months |
| Ergonomic task seating | $400 – $1,800 | $3–17 return per $1 invested (JOEM) | 3–12 months |
| Occupancy sensor deployment | $50 – $200/desk | 20–30% real estate cost reduction | 8–24 months |
| Smart meeting room furniture | $2,000 – $8,000/room | 35% reduction in unused meeting room bookings | 12–24 months |
| AI space planning software | $15,000 – $80,000 (annual) | Optimized layouts reduce space needs by 15–25% | 12–36 months |
| Ergonomic analytics platform | $10 – $30/user/month | 22% reduction in MSD-related absenteeism | 6–18 months |
| Acoustic furniture pods | $3,000 – $15,000/unit | 28% improvement in focus work productivity scores | 18–36 months |
| Full ABW smart environment | $8,000 – $20,000/person | 30–40% reduction in total real estate cost | 24–48 months |

3. IoT-Enabled Office Furniture: The Intelligent Workspace Infrastructure
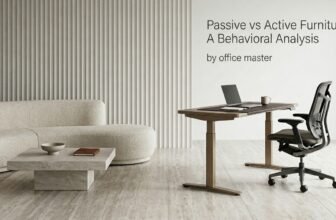
The Internet of Things (IoT) is the technological foundation upon which data-driven office furniture design is built. By embedding sensors, microprocessors, and connectivity modules into desks, chairs, collaboration furniture, and spatial infrastructure, manufacturers and technology providers have created an entirely new category of intelligent workplace assets.
IoT-enabled office furniture does not merely respond to user input — it observes, records, analyses, and communicates. This transforms furniture from a passive physical asset into an active participant in the organization workplace intelligence ecosystem.
Smart Desks: Height, Occupancy, and Personalization
The contemporary smart desk is arguably the most commercially mature IoT furniture product category. Leading manufacturers including Officemaster regional suppliers serving the office furniture Dubai market now offer height-adjustable workstations equipped with:
- Ultrasonic and infrared occupancy sensors that detect presence without requiring user action
- Electric height-adjustment motors with memory presets linked to employee profiles via RFID, NFC, or app authentication
- Integrated power management systems that cut standby consumption when desks are unoccupied
- API connectivity to workplace management platforms (IWMS), enabling real-time utilization dashboards
- Environmental sensors measuring ambient CO2, temperature, humidity, and light levels at the workstation level
- Usage logging that tracks sit/stand ratios and alerts users to sedentary behavior through connected apps
The data generated by smart desks feeds directly into space planning analytics. When an organization can see, in real time, that 30% of its workstations remain unoccupied during the 09:00–11:00 window and 70% are occupied at 14:00–16:00, it can redesign its physical environment — and procurement strategy — with a precision previously unattainable.
Intelligent Seating: Ergonomic Analytics and Postural Intelligence
The smart chair represents perhaps the most intimate intersection of data science and physical comfort. Advanced ergonomic seating systems now incorporate:
- Pressure-mapping sensors across seat pan and backrest that generate individual posture profiles
- Accelerometers that detect static posture duration and prompt movement reminders
- Connectivity to personalized ergonomic coaching applications that provide real-time adjustment recommendations
- Aggregated fleet analytics that allow facilities managers to identify chairs with inadequate adjustment ranges for specific user populations
- Predictive maintenance alerts triggered by component wear data, extending furniture lifespan and reducing unexpected replacement costs
OfficeMaster Freedom Chair among others, have incorporated varying degrees of this functionality. In the context of office furniture selection for large UAE organizations with diverse workforce — where anthropocentric variation is significant — the ability to prescribe seating based on biometric data rather than generic ‘one size fits all’ standards is commercially and medically significant.
Connected Collaboration Furniture and Meeting Intelligence
Conference rooms and collaborative furniture zones represent a disproportionate share of unused space in corporate offices globally. Smart collaboration furniture addresses this through:
- Occupancy sensors and camera-based presence detection that provide accurate meeting room utilization data
- Integration with calendar platforms (Microsoft 365, Google Workspace) to correlate booked time with actual attendance
- Acoustic intelligence systems embedded in booth and pod furniture that adjust sound masking in real time
- Display integration allowing furniture configurations to be adjusted based on meeting type detected from calendar metadata
- Post-meeting feedback prompts that build a qualitative layer atop utilization quantitative data
IoT Office Furniture Features and Data Outputs
| Furniture Category | IoT Features | Data Generated | Platform Integration |
|---|---|---|---|
| Smart sit-stand desks | Presence sensors, height memory, env. sensors | Utilization rate, sit/stand ratio, air quality | IWMS, HR, wellness apps |
| Ergonomic smart chairs | Pressure mapping, accelerometers, posture AI | Posture score, movement frequency, adjustment data | Ergonomic coaching apps, HRIS |
| Meeting room furniture | Camera presence, noise level sensors, display links | Utilization, attendance vs booking, acoustic data | Calendar, room booking, FM platforms |
| Acoustic pods/booths | Occupancy, sound masking, CO2, temp | Usage patterns, acoustic performance, air quality | Space management, HVAC integration |
| Lounge/breakout seating | Proximity sensors, dwell time tracking | Informal collaboration frequency, preference data | Space analytics platforms |
| Storage/locker systems | Smart locks, RFID, usage tracking | Allocation efficiency, access logs | Security, FM, HR platforms |
| Reception/front-of-house | Visitor detection, screen integration | Visitor flow, dwell time, experience data | Visitor management systems |

4. AI-Powered Office Space Planning: From Blueprint to Optimized Reality
Artificial intelligence is fundamentally changing the economics of workplace planning. Where traditional space planning required months of manual assessment, architectural drawing, and iterative client review, AI-powered platforms can generate, evaluate, and optimize hundreds of furniture configuration scenarios in hours — incorporating constraints that human planners would find computationally intractable.
How AI Transforms Furniture Configuration and Space Planning
Contemporary AI space planning systems — including platforms such as Archistar, TestFit, Matterport Digital Twins, and proprietary tools developed by major furniture manufacturers — operate through several interconnected capabilities:
- Generative Layout Modelling: AI algorithms generate thousands of furniture placement scenarios based on input parameters including floor plate geometry, column grid, natural light distribution, fire egress requirements, and target headcount densities.
- Multi-Objective Optimization: Machine learning models simultaneously optimize layouts against competing objectives — maximizing collaboration proximity while protecting acoustic privacy zones; minimizing travel distances while ensuring equitable access to amenity spaces.
- Predictive Space Demand Modelling: By analyzing badge access data, calendar patterns, and workforce planning data, AI systems can predict future space demand with sufficient accuracy to inform long-term procurement decisions.
- Digital Twin Integration: AI platforms connected to 3D digital twins of physical spaces enable real-time simulation of how furniture changes will affect workflow, occupancy patterns, and environmental comfort before any physical intervention occurs.
- Natural Language Interfaces: Emerging AI planning tools allow decision-makers to specify requirements conversationally (‘I need a workspace for 120 people with 60% focus stations, 30% collaborative zones, and 10% private meeting spaces’) and receive intelligent configuration recommendations instantly.
Case Application: AI Space Planning in UAE Commercial Real Estate
In the context of Dubai’s dynamic commercial real estate market — characterized by rapid growth, high tenant turnover, and diverse multinational tenancy — AI-powered office furniture planning delivers particular value. Organizations relocating to new tower developments in Business Bay, DIFC, or Dubai South can deploy digital twin platforms to model their furniture requirements with precision, avoiding the costly over purchasing that historically characterized large-scale fit-outs.
Major fit-out contractors operating in the UAE market have reported that AI-assisted furniture specification reduces preliminary design phase duration by 35-45%, decreases specification errors (and associated rework costs) by up to 28%, and enables faster landlord approval processes through higher-quality computational documentation.

5. Ergonomic Analytics: The Science of Measurable Human-Furniture Interface
Ergonomic analytics represents the quantitative revolution within the traditionally qualitative field of workplace ergonomics. Rather than relying on periodic assessment by a certified ergonomist — a valuable but infrequent intervention — ergonomic analytics platforms provide continuous, population-scale insight into how furniture is interacting with the humans who use it.
Biometric Data Collection and Postural Analysis
The most advanced ergonomic analytics systems combine hardware-embedded sensors with computer vision and machine learning to deliver:
- Real-time postural deviation detection: identifying when users adopt harmful forward head posture, asymmetric loading, or sustained static positions
- Population-level postural risk mapping: aggregating individual data to identify departments or roles with elevated MSD risk profiles
- Furniture-user compatibility scoring: correlating chair adjustment data with user anthropocentric profiles to identify mismatches requiring furniture substitution
- Movement pattern analysis: quantifying the frequency and nature of position changes, standing episodes, and micro-movement throughout the working day
- Longitudinal trend monitoring: tracking individual postural health trajectories over months and years, enabling early intervention before injuries develop
Ergonomic Benchmarks: Data Standards for High-Performance Workstations
| Ergonomic Parameter | Minimum Standard | Optimal Target | Data Collection Method |
|---|---|---|---|
| Sit/Stand ratio (adjustable desk users) | 60% sit / 40% stand | 50% sit / 50% stand | Smart desk height sensors |
| Standing episode duration | Minimum 20 min/hour | 2–3 episodes of 20–30 min | Desk sensor + wearable |
| Screen eye distance | 50–70 cm | 55–65 cm (user-specific) | Workstation camera AI |
| Seat-to-desk height ratio | Within 5cm of ideal | Exact biometric match | Pressure sensor + input |
| Lumbar support contact | >70% working time | >85% working time | Chair pressure mapping |
| Head/neck forward deviation | <15 degrees | <10 degrees sustained | Posture AI / camera |
| Keyboard tilt angle | 0–15 degrees negative | Neutral to -5 degrees | Keyboard sensor / obs. |
| Movement frequency | 1 position change / 20 min | 1 change / 10–15 min | Accelerometer / sensor |
| Sedentary stretch duration | <60 min unbroken | <30 min unbroken | Smart desk + wearable |
| Monitor height vs. eye level | +/- 0–5 cm eye level | Top of screen at eye level | Vision AI measurement |
From Individual to Population: Ergonomic Analytics at Scale
The transformative potential of ergonomic analytics is most powerfully realized at population scale. When an organization with 500 employees can see that engineers in a particular department have an average lumbar support contact rate of 52% — well below the optimal 85% threshold — this is not an abstract statistic. It is a procurement signal indicating that the chairs in that area are likely mismatched to their users, and that the ROI case for chair replacement is concrete and calculable.
Leading HR technology vendors working within the office furniture supply chain have developed platforms that feed ergonomic analytics data directly into HR information systems, enabling organizations to connect physical workspace quality metrics with attendance data, performance reviews, and healthcare utilization — creating a genuinely integrated picture of how furniture decisions affect the bottom line.

6. Activity-Based Working and the Data Architecture of Flexible Furniture Ecosystems
Activity-Based Working (ABW) is one of the most significant workplace design philosophies of the past two decades — and it is fundamentally incompatible with intuition-based furniture design. ABW environments, in which employees do not have assigned desks but instead choose from a range of work settings based on the task at hand, require sophisticated data infrastructure to function effectively.
The Data Requirements of Successful ABW Implementation
Research consistently demonstrates that ABW implementations fail — generating employee dissatisfaction and productivity loss — when they are not backed by robust occupancy data and responsive furniture allocation systems. The critical data requirements include:
- Baseline utilization data: Pr-implementation sensor surveys that accurately establish current usage patterns across all work settings
- Activity profiling: Systematic analysis of the types of work performed by different roles — determining the actual proportion of focus work, collaborative work, phone-based work, and learning activities
- Neighborhood capacity modelling: Data-driven calculation of the optimal desk-sharing ratio for each team or department based on their attendance and activity profiles
- Real-time availability systems: Sensor-connected desk and room booking platforms that provide employees with live visibility of available work settings
- Post-implementation measurement: Ongoing utilization tracking to verify that the designed environment is actually used as intended
In the UAE market, where organizations often have workforces with diverse cultural expectations around personal workspace and hierarchy, activity-based working implementations require particularly careful data-informed planning. Cultural nuance must be incorporated into activity profiling methodologies to avoid designing environments that function well on average but fail specific employee populations.
Activity-Based Work Setting Design Ratios — Data-Informed Benchmarks
| Work Setting Type | Recommended % of Total Area | Desk-Sharing Ratio | Key Furniture Specification |
|---|---|---|---|
| Focus workstations | 30–40% | 0.7:1 to 0.9:1 | Height-adj. desks, acoustic screens, privacy panels |
| Open collaboration zones | 20–30% | N/A (shared zones) | Modular soft seating, writable surfaces, AV integration |
| Small meeting rooms (2–4) | 10–15% | Booking-based | Compact meeting tables, integrated VC, acoustic treatment |
| Large meeting rooms (6–12) | 8–12% | Booking-based | Boardroom / conference tables, presentation-ready |
| Phone/video booths | 5–8% | Hoteling / booking | Single-person acoustic pods, integrated power + display |
| Informal lounge settings | 8–12% | N/A | Soft seating, high tables, touchdown surfaces |
| Quiet/focus rooms | 5–8% | Booking-based | Minimal desk, acoustic pod or room, no collaboration |
| Amenity/social spaces | 5–10% | N/A | Café-style furniture, varied height, informal groupings |

7. Sustainable Furniture Design Through a Data Lens: ESG and Circular Economy
Environmental, Social, and Governance (ESG) considerations have become central to procurement decisions in global organizations, and the UAE is no exception — with Vision 2031 sustainability frameworks placing increasing pressure on businesses to demonstrate environmental responsibility in capital expenditure decisions. Data-driven office furniture design offers a powerful toolkit for organizations seeking to align their workplace investments with ESG commitments.
Lifecycle Analytics and Circular Economy Furniture Management
Traditional furniture procurement treated the end of useful life as an afterthought. Data-driven approaches enable organizations to manage furniture as circular assets through:
- Predictive maintenance data that extends asset lifespan by 20-35% through early intervention on wear components
- Utilization data that identifies underused furniture suitable for redeployment rather than disposal
- Manufacturer take-back integration where IoT platforms automatically initiate end-of-life processes when furniture reaches defined usage thresholds
- Carbon accounting tools that calculate the embodied carbon of furniture procurement decisions and compare alternatives
- Material passport platforms that track the composition of furniture assets to facilitate component recovery and recycling at end of life
LEED, WELL, and BREEAM: Certification Data Requirements
For organizations pursuing green building certifications — including LEED v4.1, WELL Building Standard v2, and BREEAM — data-driven furniture selection is not merely advantageous but in many cases prerequisite. The WELL Building Standard’s Ergonomics concepts require documented ergonomic assessment data to achieve certification credits. LEED’s Materials and Resources credits require verified lifecycle assessment (LCA) data from furniture manufacturers. BREEAM’s Health and Wellbeing categories reward workplaces that demonstrate evidence-based ergonomic specification.
In Dubai’s premium commercial market, where Grade A buildings increasingly pursue LEED Platinum and WELL Gold certification as differentiators in tenant attraction, the ability to provide data-backed furniture specification documentation is a meaningful competitive advantage for fit-out contractors and facility managers.

8. Smart Workstation Technology Stack: A Buyer’s Guide for Decision-Makers
For facilities managers and procurement leaders evaluating data-driven furniture investments, understanding the technology ecosystem is essential for making informed vendor selection decisions. The following framework maps the key technology layers in a comprehensive smart workstation deployment.
| Technology Layer | Function | Leading Vendors | Integration Requirement |
|---|---|---|---|
| Occupancy Sensing | Detect presence at desk/room level | Verkada, Density, Disruptive Tech, Meraki | Wi-Fi/PoE network, IWMS API |
| Smart Desk Hardware | Height adjustment, env. monitoring | Linak, Ergotron, Logicdata, Loctek Pro | USB/Bluetooth, IWMS integration |
| Ergonomic Analytics | Posture scoring, movement tracking | Humanscale Intelligence, Ergosight, Darma | HR platform, wellness app API |
| IWMS Platform | Aggregates all space/asset data | Archibus, FM:Systems, Planon, SpaceIQ | Central data hub, BI tool output |
| Digital Twin | 3D virtual workplace model | Matterport, Autodesk Tandem, IrisVR | CAD/BIM files, sensor data feeds |
| AI Space Planning | Layout optimization, scenario modelling | Archistar, Spacemaker, TestFit | Floor plans, workforce data inputs |
| Employee Workplace App | Desk booking, wayfinding, reporting | Condeco, Envoy, Robin, Eptura | Calendar, LDAP, sensor integration |
| Analytics & Reporting | BI dashboards, executive reporting | Power BI, Tableau, Looker Studio | IWMS data warehouse connection |
Implementation Considerations for UAE Organizations
Organizations deploying smart office furniture infrastructure in the UAE face several market-specific considerations that differ from European or North American deployments:
- Data residency requirements: UAE data protection regulations (Federal Decree-Law No. 45 of 2021) require careful evaluation of where workplace data — particularly biometric ergonomic data — is stored and processed. Many global IWMS vendors now offer UAE-based data centers to address this requirement.
- Network infrastructure: Dubai’s premium commercial districts generally offer excellent connectivity infrastructure, but organizations in free zone developments should verify latency and reliability specifications for real-time IoT data transmission.
- Workforce diversity: With over 200 nationalities represented in Dubai’s workforce, any ergonomic analytics deployment must account for significant anthropometric variation in its furniture specification parameters.
- Climate considerations: The extreme UAE climate affects furniture material performance — UV-stable finishes, heat-tolerant upholstery, and humidity-resistant components should be specified for any exterior-facing or high-HVAC-flux environments.
- Cultural workspace preferences: Data collection methodologies should be validated against cultural norms around workplace monitoring and privacy to ensure employee trust and participation.
9. Measuring Workplace Productivity: Connecting Furniture Data to Business Outcomes
The ultimate test of any data-driven furniture investment is its measurable impact on the outcomes that matter to business leaders: employee productivity, talent retention, health expenditure, and real estate cost efficiency. This section outlines the measurement frameworks that allow organizations to close the loop between furniture data and business performance.
The Workplace Productivity Measurement Framework
Mature organizations in this space typically adopt a multi-layer measurement approach that combines:
- Objective utilization metrics: Desk and room occupancy rates, activity setting usage distribution, average dwell times by setting type — derived from IoT sensor data.
- Subjective experience scores: Leesman Index assessments, internal eNPS (employee net promoter score) with workplace-specific modules, and periodic ergonomic comfort surveys.
- Health and absenteeism data: Anonymized analysis of sick leave frequency and duration correlated with furniture environment quality — a methodology that requires careful GDPR/data protection compliance in multi-jurisdiction organizations.
- Performance proxy indicators: Role-appropriate output metrics (code commits for developers, call resolution times for customer service, deal velocity for sales teams) correlated with workspace assignments.
- Real estate cost per effective seat: A compound metric that divides total real estate cost by the number of seats that achieve a defined utilization threshold — revealing the true cost of under performing furniture configurations.
| KPI | Measurement Method | Benchmark (High Performing) | Reporting Frequency |
|---|---|---|---|
| Desk utilization rate | IoT occupancy sensors | >75% of available seats occupied during core hours | Real-time / daily |
| Employee workplace satisfaction | Leesman Index / internal survey | Leesman Lx score >55 (top quartile) | Quarterly |
| Ergonomic risk score | Analytics platform assessment | <20% of population at elevated MSD risk | Monthly |
| Focus work effectiveness | Survey / biometric focus indicator | >70% positive rating for focus capability | Quarterly |
| Meeting room utilization | Sensor + calendar data | 60–75% of booked time = actual occupancy | Weekly |
| Cost per effective seat | RE cost / utilised seats | Reduction of 15–25% vs. baseline | Quarterly |
| Sit/stand compliance | Smart desk sensors | >60% of users achieving target ratios | Monthly |
| Furniture-related sick leave | HRIS correlation (anonymized) | <15% of MSD leave attributable to workstation | Quarterly |
| Post-occupancy NPS | Internal workplace survey | >+30 net promoter score for workspace quality | Bi-annually |
| CO2 embodied per seat | Lifecycle analytics | Year-on-year reduction vs. baseline | Annually |

10. Future Trends: The Next Frontier of Data-Driven Office Furniture Design
The field of data-driven office furniture is evolving at a pace that makes today’s leading implementations tomorrow’s standard practice. Decision-makers who wish to maintain strategic advantage must understand not only current best practice but the trajectory of innovation shaping the next five to ten years.
Neuro-Adaptive Workstations
Emerging research in cognitive neuroscience is informing a new generation of adaptive workstation concepts that respond not merely to physical posture but to cognitive state. Prototype systems using EEG-based headsets and galvanic skin response sensors are demonstrating the ability to detect cognitive load, stress levels, and concentration depth in real time — enabling workstations to automatically adjust lighting, temperature, sound masking levels, and even desk height to optimize conditions for the specific cognitive task underway. While commercial deployment remains 3-7 years away, the underlying sensor technology is maturing rapidly, and organizations building data infrastructure today will be well positioned to integrate these capabilities as they arrive.

AI-Generated Personalized Furniture Specifications
The convergence of 3D body scanning technology, generative AI, and direct digital manufacturing is creating a pathway to mass-furniture specification at scale. Systems currently in development by manufacturers including Knoll, Vitra, and emerging startups can generate individualized desk, chair, and monitor arm specifications from a 60-second body scan, feed these specifications directly to CNC manufacturing systems, and deliver purpose-built workstations within standard commercial lead times. For large organizations in markets like Dubai where workforce anthropometric diversity is exceptional, this represents a transformative improvement over current catalogue-based procurement.
Spatial Computing and AR Workplace Planning
Apple Vision Pro and competing spatial computing platforms are already being piloted by leading architectural practices and furniture manufacturers for immersive workplace planning experiences. Decision-makers can walk through photorealistic virtual representations of proposed furniture configurations — experiencing scale, adjacency, and light quality — before any commitment is made. As these platforms mature and hardware costs decline, they are expected to become standard tools in the workplace design procurement process.
Blockchain-Based Furniture Provenance and ESG Reporting
Enterprise sustainability reporting requirements — including the EU Corporate Sustainability Reporting Directive (CSRD) and equivalent frameworks emerging in the UAE under Vision 2030 sustainability goals — are driving demand for verifiable, auditable data on the environmental provenance of furniture assets. Blockchain-based material passport systems, piloted by manufacturers including Shaw Industries and Interface in flooring, are being adapted for furniture to provide immutable records of material sourcing, manufacturing emissions, and end-of-life processing — enabling organizations to report on Scope 3 furniture-related emissions with the same rigour currently applied to energy consumption.
The Workplace-as-a-Service (WaaS) Model
The intersection of smart furniture data, flexible lease structures, and IoT-enabled condition monitoring is enabling a fundamental commercial model shift: from capital expenditure furniture procurement to subscription-based Workplace-as-a-Service. Under WaaS models — already being piloted by manufacturers including officemaster workplace solutions division — organizations pay a per-seat monthly fee that includes furniture provision, maintenance, data analytics, and periodic refresh based on utilization data. This model eliminates capital expenditure, provides continuous access to the latest technology, and aligns furniture costs directly with actual space utilization. For CFOs in UAE organizations dealing with rapid headcount volatility, WaaS offers compelling financial flexibility.

11. Building Your Data-Driven Furniture Strategy: A Practical Roadmap
Translating the principles outlined in this guide into a coherent, executable strategy requires a structured approach that accounts for organizational maturity, available technology infrastructure, and the specific business objectives driving the investment. The following roadmap provides a practical framework for leaders embarking on this journey.
Phase 1: Baseline Assessment (Months 1-3)
- Deploy occupancy sensors across all work settings and collect a minimum of 8 weeks of utilization data across seasonal variation
- Conduct Leesman Index or equivalent workplace experience assessment to establish employee satisfaction baseline
- Perform ergonomic risk assessment of existing furniture population, prioritizing highest-risk user groups
- Audit existing furniture asset data: age, condition, adjustment capability, manufacturer specification vs. user population needs
- Map current technology infrastructure: network capacity, IWMS capability, HR data systems integration potential
Phase 2: Strategy and Business Case Development (Months 3-5)
- Analyze baseline data to identify highest-priority intervention areas by expected ROI
- Model furniture configuration scenarios using AI planning tools against organizational growth projections
- Develop quantified business cases for each investment category using the ROI framework provided in Table 2
- Define success metrics and measurement infrastructure requirements aligned with organizational KPIs
- Conduct stakeholder alignment workshops with HR, IT, Real Estate, Finance, and employee representative groups
Phase 3: Pilot Deployment (Months 5-9)
- Select a representative pilot zone encompassing 10-15% of total workspace
- Deploy full technology stack including smart furniture, sensors, analytics platforms, and employee-facing apps
- Run controlled comparison between pilot zone and control environment to generate internal evidence
- Collect qualitative employee feedback through structured interviews and focus groups
- Refine specifications, configurations, and data collection methodologies based on pilot learning
Phase 4: Full Deployment and Continuous Optimization (Months 9+)
- Scale deployment based on pilot evidence, prioritizing highest-ROI areas first
- Establish ongoing governance processes for data review, configuration adjustment, and procurement decisions
- Integrate workplace data with HR, finance, and real estate systems for holistic performance reporting
- Implement annual furniture performance reviews informed by accumulated utilization and ergonomic data
- Maintain forward-looking technology watch to integrate emerging capabilities as they mature

FAQs: Data-Driven Office Furniture Design
What does ‘data-driven office furniture design’ actually mean in practice?
In practical terms, it means using sensor data, occupancy analytics, ergonomic measurement platforms, and AI planning tools to make every furniture decision — from chair selection to desk placement to room configuration — based on evidence rather than assumption. Instead of guessing how your office is used, you measure it. Instead of estimating ergonomic risk, you quantify it. The result is a workspace precisely calibrated to the needs of its users and the objectives of the organization.
Smart office furniture commands a price premium of approximately 20-40% over standard equivalents at the point of purchase. However, when lifecycle value is considered — including reduced maintenance costs (15-25% lower with predictive maintenance data), extended usable lifespan (20-35% longer), real estate savings from occupancy optimization (20-30%), and productivity gains — total cost of ownership is typically neutral to positive within 18-36 months. The business case is strongest for organizations with 100+ seats and high real estate costs — both of which characterize much of Dubai’s commercial market.
Which office furniture sensors are most important to deploy first?
For organizations beginning their data journey, desk occupancy sensors offer the highest immediate return on investment. They are relatively inexpensive to deploy, generate immediately actionable utilization data, and provide the baseline evidence needed to justify more complex investments. Meeting room occupancy sensors are a close second. Ergonomic analytics hardware — while highly valuable — typically requires more change management investment and is best introduced in Phase 2 or 3 of a maturity roadmap.
Does ergonomic data collection comply with employee privacy regulations in the UAE?
Yes, provided the deployment is designed with privacy by design principles and complies with UAE Federal Decree-Law No. 45 of 2021 on Personal Data Protection. Key requirements include obtaining informed employee consent, ensuring data is anonymized for aggregate analytics, providing employees access to their own individual data, and storing biometric data within UAE-resident systems if required. Legal counsel should review any ergonomic analytics deployment that captures identifiable health-related data.
What is the average desk utilization rate in UAE corporate offices?
Based on occupancy studies conducted across Dubai and Abu Dhabi commercial offices, average desk utilization in UAE corporate environments ranges from 55-70% during core hours (09:00-17:00), with significant variation by industry. Financial services and legal firms tend to have higher utilization rates (65-75%), while technology companies and professional services firms with hybrid working policies frequently see rates of 45-60%. Post-pandemic, most organizations in the UAE have established stable hybrid attendance patterns of 3-4 days per week, making the case for desk-sharing models compelling.
Can AI really predict how office furniture should be configured before a fit-out?
Yes, with meaningful accuracy. Modern AI space planning platforms — when provided with accurate input data including floor plans, workforce composition, activity profiles, and cultural preferences — can generate optimal furniture configurations that outperform human-designed layouts on measurable criteria including utilization rate, collaboration proximity, and acoustic privacy. Several major fit-outs in Dubai completed between 2022 and 2024 used AI planning tools, and post-occupancy evaluations have validated that AI-generated configurations achieved target utilization rates 15-22% more consistently than traditionally designed equivalents.
What is activity-based working and how does data support it?
Activity-based working is a workplace design philosophy in which employees do not have assigned desks but choose work settings based on their task — quiet focus booths for concentrated work, open collaboration tables for teamwork, phone booths for calls. Data supports ABW by providing the occupancy evidence needed to calibrate the ratio of different setting types to actual demand, ensuring there are neither too few focus spaces on busy days nor wasted square footage from over-provisioning.
How do height-adjustable desks improve productivity, and how is this measured?
Height-adjustable desks improve productivity through multiple pathways: they reduce musculoskeletal discomfort (improving concentration and reducing absenteeism), they increase movement throughout the day (linked to improved cognitive function and energy levels), and they provide employees with a greater sense of control over their environment (associated with higher engagement). These effects are measured through a combination of self-reported productivity assessments, ergonomic risk scores from sensor platforms, absenteeism tracking in HRIS systems, and longitudinal health assessments. Multiple controlled studies report productivity improvements of 15-25% among consistent users of sit-stand workstations.
What ROI metrics should I present to my CFO to justify smart furniture investment?
CFOs in commercial organizations respond best to three categories of ROI evidence: cost avoidance (reduced real estate costs through occupancy-optimized space planning — typically 20-30%), risk reduction (lower workers compensation and healthcare costs associated with ergonomic MSD prevention — typically 10-20% reduction in relevant claims), and revenue-linked productivity (employee output improvements linked to ergonomic and environmental optimization — typically 15-25% improvement in self-assessed productivity). Present these as a weighted portfolio, not individual line items, and anchor each figure to internal pilot data wherever possible.
What is the difference between occupancy data and utilization data in office furniture planning?
Occupancy data records whether a space is physically occupied at a given moment — typically measured in binary (occupied/unoccupied) through PIR, ultrasonic, or camera-based sensors. Utilization data is derived from occupancy data over time, expressing what percentage of available time a space is actually used. For furniture planning purposes, utilization data is the more valuable metric — a desk that is occupied 60% of core hours has a utilization rate of 60%. Occupancy data feeds into real-time room booking and wayfinding applications, while utilization data informs strategic furniture procurement, space planning, and leasing decisions.
How does smart furniture integrate with existing IWMS and HR platforms?
Most enterprise-grade smart furniture platforms offer API-based integration with leading IWMS platforms (Archibus, Planon, FM:Systems, SpaceIQ) and HR information systems (Workday, SAP SuccessFactors, Oracle HCM). Integration depth varies by vendor — some provide pre-built connectors while others require custom development. A typical integration passes occupancy and utilization data from furniture sensors to the IWMS for reporting, and pulls employee roster data from HR systems to enable personalized desk booking and ergonomic profile management. Organizations evaluating smart furniture vendors should explicitly assess integration capability against their existing technology landscape.
Is sustainable office furniture more expensive, and does the data support the investment?
Certified sustainable office furniture — carrying GREENGUARD Gold, Cradle to Cradle, or FSC Chain of Custody certifications — typically commands a 10-20% price premium over standard equivalents. However, lifecycle data consistently shows that sustainably manufactured furniture achieves longer usable lifespans (often 15-20 years vs. 7-10 years for commodity products), reducing total cost of ownership to neutral or positive over a 15-year horizon. For UAE organizations with ESG reporting obligations or sustainability certification targets, the premium also carries material reputational and regulatory value that is not captured in direct cost comparison alone.
How do I start collecting office furniture utilisation data with limited budget?
A cost-effective entry point is passive infrared (PIR) desk occupancy sensors, which are available from vendors including Disruptive Technologies, Pressac, and Enviro+ at costs of USD $30-80 per sensor. Paired with a cloud analytics platform (many offer freemium tiers for small deployments), this provides meaningful utilization data within weeks. Organizations with existing Microsoft 365 or Google Workspace deployments can supplement sensor data with calendar analytics tools that infer occupancy from meeting booking patterns — a no-hardware starting point that, while less precise than sensor data, provides useful directional intelligence at near-zero incremental cost.
Over the next five years, AI will progressively automate and enhance three areas of office furniture procurement. First, specification intelligence — AI will recommend optimal furniture specifications based on workforce data, activity profiles, and biometric parameters, reducing the time required for ergonomic assessment from days to minutes. Second, layout optimization — generative AI will produce furniture configurations that are continuously refined by live occupancy data, creating self-optimizing workspace environments. Third, predictive procurement — AI will anticipate furniture replacement needs based on usage data and condition monitoring before failures occur, shifting procurement from reactive to proactive and significantly reducing total cost of ownership across large furniture estates.
Intelligence is the New Standard in Workplace Furniture
The organizations that will define the next decade of workplace excellence are those that treat office furniture not as a commodity but as a strategically managed, data-generating asset class. The evidence is unambiguous: workplaces designed and continuously optimized through data — occupancy intelligence, ergonomic analytics, AI-powered configuration, and IoT-enabled feedback loops — consistently outperform those managed by intuition on every dimension that matters to business performance.
The return on investment is measurable and compelling. The technology infrastructure to deliver it is mature and commercially accessible. The workforce benefit — in health, comfort, engagement, and productivity — is increasingly non-negotiable in competitive talent markets. And in a city like Dubai, where world-class ambition drives every capital investment decision, data-driven office furniture design is not a futuristic aspiration. It is an immediate, available competitive advantage.
OfficeMaster.ae brings specialist expertise in data-informed office furniture specification, procurement, and deployment to organizations across the UAE and GCC region. Whether your organization is beginning its workplace intelligence journey with baseline occupancy measurement, or advancing to AI-powered space planning and IoT-integrated smart workstations, our team provides the strategic guidance and product expertise to translate data into environments where people perform at their best.
The furniture of the future is not simply where people sit. It is a dynamic, intelligent system that continuously learns, adapts, and optimizes — placing the human experience at the center of every data point it generates. The question for today’s leaders is not whether to embrace this shift, but how quickly they can build the capabilities to lead it.
About OfficeMaster.ae
OfficeMaster.ae is a leading office furniture supplier and workplace design consultancy serving businesses across Dubai, Abu Dhabi, and the wider UAE. We specialize in ergonomic seating, height-adjustable workstations, smart office furniture solutions, and complete commercial office fit-outs. Our data-informed specification methodology ensures every procurement decision is grounded in workplace intelligence, delivering measurable returns for our clients.